
The Relative Age Effect refers to a bias in performance and participation due to selection periods, such as school years, with the oldest within an age group having an advantage over the youngest. It has been widely observed in academia and sports. In his best selling book Outliers Malcolm Gladwell reports the effect in Canadian youth hockey players, where the selected players were overwhelming born towards the start of the year. And just this week the UK education minister announced she would be unveiling measures to overcome the relatively weaker academic performance of summer born children, an effect of the selection period running from September to August.
This summer my wife and I celebrated the arrival of our first child, Beatrix. A birthday in July places her towards the rear of the UK academic year selection period, so with that in mind I decided to check the relative age effect for myself. In this post I look at European Football leagues to see if the effect is really apparent; in a following post I’ll look at UK track and field athletics.
European Football
The relative age effect has long been known about, the previously mentioned study into ice hockey success is over 30 years old. It has been observed in football before, and measures have been announced to combat it.
In football the search for talent is extensive and well-funded. Furthermore, top teams are often keen to suggest that they make use of so called Moneyball techniques, applying a similar statistical approach to player recruitment as pioneered by the Oakland A’s in baseball. I therefore assumed something as simple as the relative age effect would have been overcome. In fact I found that the effect remains very strong.
Data
I examined the squads for national football leagues listed on the excellent http://www.footballsquads.com. From these I filtered out players of the home nation; so for the English league I looked only at English players and so on. The site includes the players’ birthdays, at least for the most recent seasons. On the odd occasion this was missing I removed the relevant player.
Of course the data isn’t going to be perfect. There will be instances where, say, English players didn’t go through the English education system (had the author been able to forge a career in football he would be one such case). But in aggregate these cases won’t make a significant difference to the results.
English football
I first looked at English football as a whole. Extensive data was available from the Premier League down to the fifth tier of football in the country, the National League. For the season 2015-2016 here’s how the players’ birthdays were distributed.
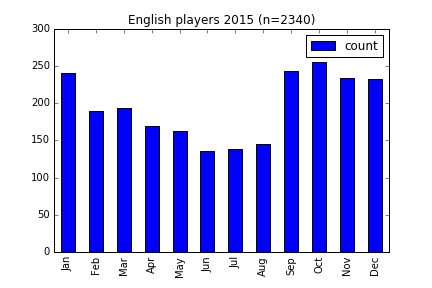
A clear trend should be visible, with the first months of the academic year, from September to January, having more players than the remainder.
The data includes a significant number of young players, since youth squads are also included, and it has been suggested elsewhere that the relative age effect is prevalent at junior level but diminishes in the senior ranks. I separated out the players into those under 20 at the start of the season and those who were not, giving the results below.
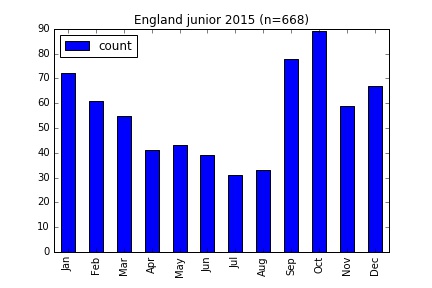
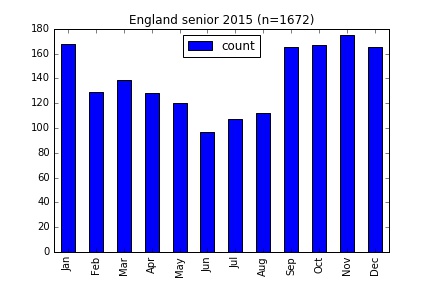
The trend is still clearly visible at both levels, though it is more prominent for the juniors. I quantify the results a bit in the table below, using three different measures of skew.
- Offset – This is how far away from the middle of the year the average birthday sits. So for example the average birthday for all English players in England is just over 23 days earlier than it would be if birthday were evenly distributed throughout the year.
- First half percentage – This is how many birthdays fall in the first half of the year.
- First to fourth quarter ratio – This is the number of birthdays in the first quarter of the year, divided by the corresponding number in the final quarter.
| Count | Offset | First half percentage | First to fourth quarter ratio | |
|---|---|---|---|---|
| All | 2340 | -23.51 | 60.09 | 1.82 |
| Senior | 1672 | -19.49 | 58.55 | 1.66 |
| Junior | 668 | -33.56 | 63.92 | 2.33 |
The figures back up what the graphs suggest, that there is a trend in both senior and junior level, but it is more pronounced for juniors.
I ran a chi-squared test on the senior data, a statistical test that indicates how likely an un-biased process would be to produce a particular distribution. Even on the senior players, with a less pronounced bias than for the juniors, the probably of no bias was 1 in 100 million.
Birth rate
In the graphs I haven’t normalised for the number of days in each month, so of course you would expect a slightly lower number of birthdays in February than months with 31 days. However more than this, we have to consider whether there is an underlying bias to the number of births in each month, perhaps there are just more babies in September?
Well in fact there are, as detailed here. However, the discrepancy in birth rates is far smaller than the difference in the number of players, and anyway the summer months of July and August also see a relatively high number of births but a relative low number of football players.
Further filtering
I examined the data across a couple of other dimensions to further examine the strength of the bias. Below is the breakdown by league, showing that the bias is present at every level. In fact the strongest bias can be seen at the highest level of the premier league.
| Count | Offset | First half percentage | First to fourth quarter ratio | |
|---|---|---|---|---|
| Premier League | 326 | -27.76 | 60.43 | 2.28 |
| Championship | 410 | -22.13 | 60.73 | 1.68 |
| League One | 539 | -23.71 | 59.93 | 1.66 |
| League Two | 555 | -19.21 | 58.74 | 1.61 |
| National League | 510 | -26.35 | 60.98 | 2.19 |
Slicing by position gives the results below, with the bias present in all cases.
| Count | Offset | First half percentage | First to fourth quarter ratio | |
|---|---|---|---|---|
| Goal Keeper | 249 | -19.87 | 55.82 | 1.76 |
| Defender | 764 | -30.34 | 62.83 | 2.22 |
| Midfield | 824 | -20.67 | 59.95 | 1.69 |
| Forward | 503 | -19.57 | 58.25 | 1.56 |
However, it is worth pointing out that some progress may be underway in England. The table below shows the figures for all players across the seasons starting in 2008, 2012 and 2016. It looks like the bias is diminishing.
| Count | Offset | First half percentage | First to fourth quarter ratio | |
|---|---|---|---|---|
| 2008 | 2210 | -28.15 | 62.22 | 2.06 |
| 2012 | 2353 | -24.19 | 60.73 | 1.92 |
| 2016 | 1991 | -22.17 | 59.37 | 1.76 |
Other nations
I applied the same analysis on other European leagues. However in these countries differ from England in that the selection period runs across the calendar year, from January through to December. But you could probably deduce that from the graphs below.
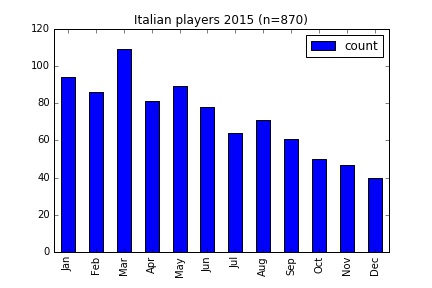
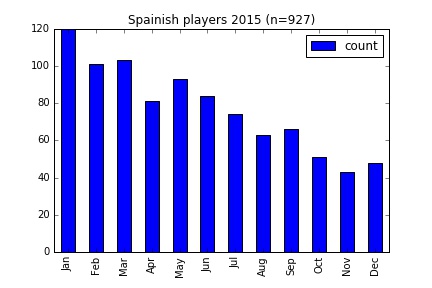
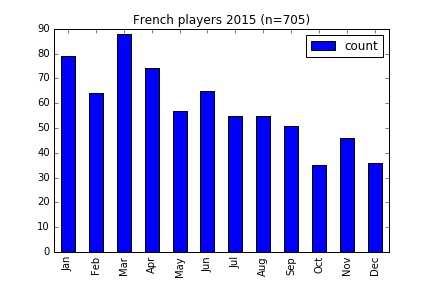
The leagues are compared in the table below. In every case there are more than twice as many players from the first quarter of the year compared to the last.
| Count | Offset | First half percentage | First to fourth quarter ratio | |
|---|---|---|---|---|
| Spain | 927 | -31.74 | 63.86 | 2.36 |
| Italy | 870 | -27.81 | 62.30 | 2.19 |
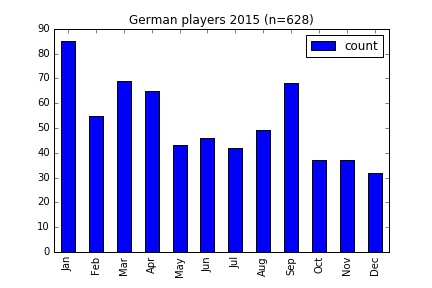
| Germany | 628 | -23.84 | 58.60 | 2.10 |
| France | 705 | -26.09 | 61.42 | 2.02 |
The case of Scotland
The graph of Germany above doesn’t show as clear a trend as, say, Spain. I believe this is because there may be two competing selection periods. One is the selection period for youth football teams which I understand to run from January to December. The other is the academic year at school, which I think varies by region.
Another country in which these two selection periods differ is Scotland. The oldest children in the school class have a March birthday, while sports teams are organised from January to December. Below are graphs for Scottish players from 2010 and 2015.
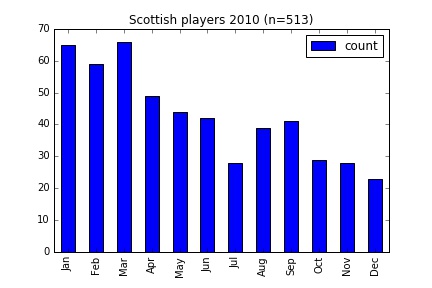
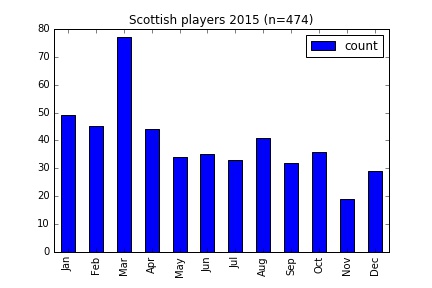
There’s a clear trend favouring the start of the year, and at least in the 2015 data huge spike at the start of the academic year in March. The particular case of Scotland is discussed here.
Conclusion
The explanation for the bias given in Outliers and elsewhere is simple enough. Players who grow up competing towards the top of their age group can be up to a year more physically developed than their peers. As such they are more likely to be picked for representative teams, and the trend is thus re-enforced over the years as they are selected for further training and development.
Although the relative age effect has long been known about in European football, it has yet to be combated. The graph for Spain above shows a very striking trend favouring those born early in the year. In recent years the country has been the most successful in Europe at club and international level, despite surely overlooking players born later in the year who must be the equal of their contemporaries born at the start of the year.
In a future post I’ll examine track and field athletics in the UK.
Code
The python code I used can be found on GitHub here.
Notice
The Source of Material is http://www.footballsquads.com. Material: © FootballSquads.com, 1999 – 2016, All Rights Reserved