
As you may have heard, Donald Trump was elected president of the United States.
Much of the press reaction has concerned the search for the Trump voter, who has variously been identified as being white, male, rural, poor and living in the rust belt.
Another factor also acts as a predictor of Trump support: obesity. The 17 states with the greatest levels of obesity all selected him, while Hillary Clinton was selected almost as overwhelmingly by the less obese states.
So, we can say that Trump rode a wave of fat support to the White House? Actually no, there’s a bit more to it than that…
Weight of the Trump vote
The graph below shows the US states ordered by prevalence of obesity, where obesity is the standard definition of having a BMI over 30. As should be clear, there is a strong bias towards Trump for the more obese states and Clinton for those at the other end of the scale.
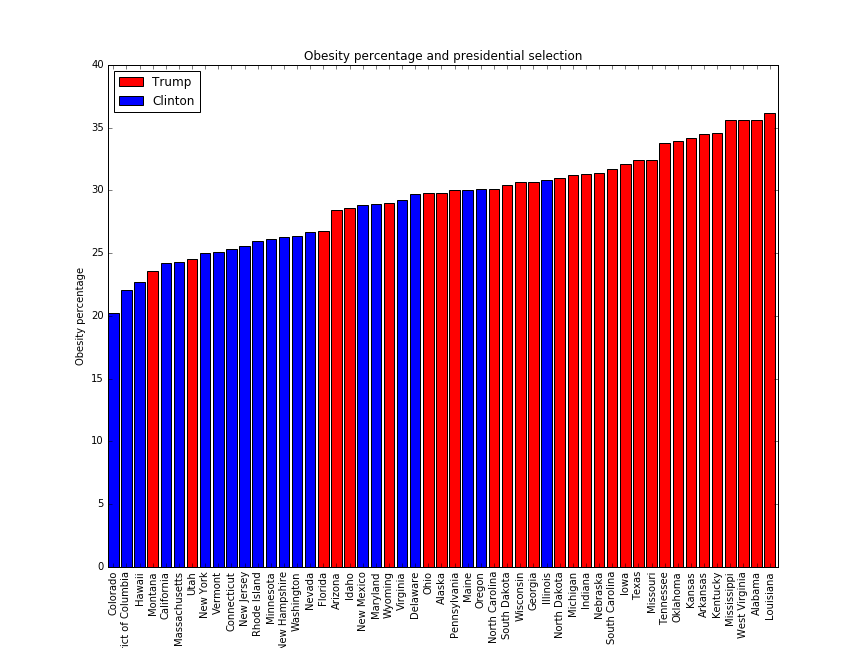
The plot below presents the data in a different way. The rate of obesity is plotted against the percentage of votes that Trump received, showing a strong trend of increasing obesity being matched by an increase in Trump votes.
We can quantify the relationship by calculating the correlation between the two measures. Obesity rate has a correlation ratio of 0.7 with Trump vote share, where a value of 0 would imply no relationship and 1 an exact match.
This represents a pretty strong correlation. So, fat people voted Trump, right?
Different in Dixie
Here is a plot of obesity against Trump vote for the counties within the state of Alabama. This is a state with a high obesity prevalence and strong Trump support (as well as being the first state alphabetically), so we would probably expect to see the more obese counties coming out for Trump.
Well there is a strong trend here too, but it is in the opposite direction. The higher the obesity rate in a county, the lower the Trump vote.
Again we can measure the correlation, and it is -0.7. So within the state of Alabama obesity is correlated equally, but oppositely, to the correlation seen across states. So now fat people don’t vote Trump, they do the exact reverse.
Race for the White House
So what’s going on? A further look at Alabama gives us a clue.
This is black population share in an Alabama county against Trump vote. The negative correlation, measured at -0.98, couldn’t be much clearer. Neither could the message, black people did not vote for Trump. In fact the graph implies more than that; it suggests not only that the black population didn’t vote Trump, but nearly everyone else did. (This isn’t really the place to discuss the stark racial divide in political preferences, but my word is it stark.)
Obesity is more prevalent in the US among the black population. With this demographic overwhelmingly voting against Trump this leads to a negative correlation between obesity and Trump votes.
Further education
However, at a national level, there are far more white voters than any other racial demographic. White women with college degrees are less likely to be obese than those without.
As the graph below shows, the Trump vote share was negatively correlated with the percentage of the population holding bachelor degrees. In fact the correlation coefficient was -0.82, so more correlated than obesity.
The plot below shows this even more clearly. Here states are ranked by the percentage of population holding an advanced degree. This is a remarkably good determinant of which candidate they selected, with only the relatively lowly educated Nevada bucking the trend by selecting Clinton.
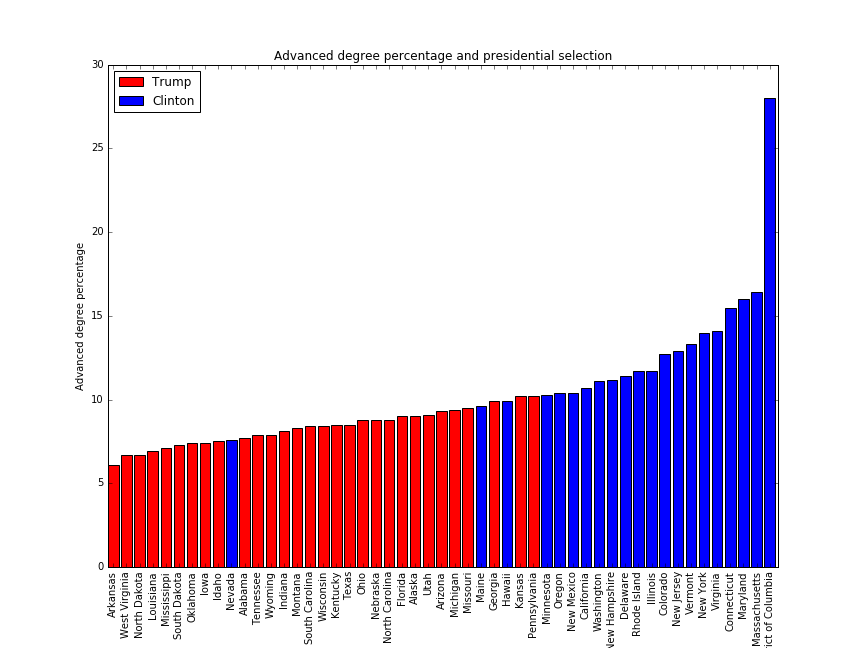
Of course, just as the state-level correlation of obesity and Trump votes doesn’t necessarily imply that the obese are voting Trump, the same should be said about the correlation with education level. However this time there is additional voter-level data that does indicate a tendency for the college educated to select Clinton, and I found no counter-correlation at the county level. In fact in Alabama there was no correlation at all between educational attainment and candidate preference (because it was so dominated by race).
So at a national level, those without college degrees favoured Trump. They are more likely to be obese, hence why the most obese states selected him.
Confession
As remarked above, there was a strong negative correlation between obesity and voting Trump in Alabama, as a county’s obesity increased its tendency to back Trump fell. However this isn’t true for all states, and in truth I didn’t pick Alabama purely because it is first alphabetically. The same correlation was also present for another southern state with very similar demographics, Mississippi, but not for others I looked at such as Florida.
Conclusion
So what does this tell us? Frankly, in terms of voter behaviour, not much. The results of the presidential election will be examined in enormous depth by pollsters looking to salvage their reputation and political bodies looking to shape future campaigns. They will have detailed voter-level data to analyse and will be able to draw far stronger conclusions that can be inferred from the raw voting results that I was looking at.
However, what this does show is how it would be possible to draw entirely different conclusions from looking at the election results, but aggregated and filtered in a different way. A narrative could be developed of overweight people either voting or not voting for Trump depending on how the data was presented.
This is an example of the ecological fallacy, in which you assume individual behaviour can be deduced from the nature of a group to which they belong. So here I assumed that more obese people would vote Trump at an individual level because of what I had seen at the aggregate level. Of course I could conceivably be making a further incorrect assumption about the link to race, but there is individual-level data available elsewhere that indicates this is very unlikely.
I think this illustrates how our preconceived ideas shape our interpretation of data. If I’m honest, I was willing to accept the idea that overweight people voted for Trump. Having seen that the more obese states selected him, based on my notion of where his support comes from I was happy to conclude that it was the overweight people themselves voting for Trump. Thus it was a surprise to find that, in Alabama at least, this wasn’t exactly the case.
However, had I detected a correlation between high levels of migration and Trump support, I wouldn’t have jumped to the conclusion that it was the migrants placing their cross in the Trump box. I would have considered the possibility it was the non-migrant population, as a reaction to migration, and hence would not have been surprised had the county-level correlation run counter to the state-level.
Brexit footnote
Many political parallels have been drawn between the UK Brexit vote and the election of Trump. There is a highly identifiable geographic link between obesity and voting leave, as discussed here, which is why I started to look at obesity and the US election.
In regard to the link between Brexit and obesity I found that the link to voting “leave” could be entirely attributed to education attainment. There is a strong positive correlation between the percentage of the population holding a university degree and the tendency to vote remain. Adding obesity as a predictor of the leave vote makes next to no difference at all. In other words, obese populations favoured leave, but this could be explained entirely by their relative lack of further education.
Data sources